


The University of the Philippines Open University (UPOU) Office of the University Registrar (OUR) has launched its first Interactive Data Analytics Dashboard, a data-driven initiative that transforms institutional data into meaningful insights.
The Analytics Dashboard, now available on the OUR website, provides interactive visualizations and statistical summaries across three modules: Admissions (application volumes and admission rates), Enrollment (student population and enrollment trends by program, academic term, and faculty), and Graduation (graduate counts by program, faculty, and academic term).
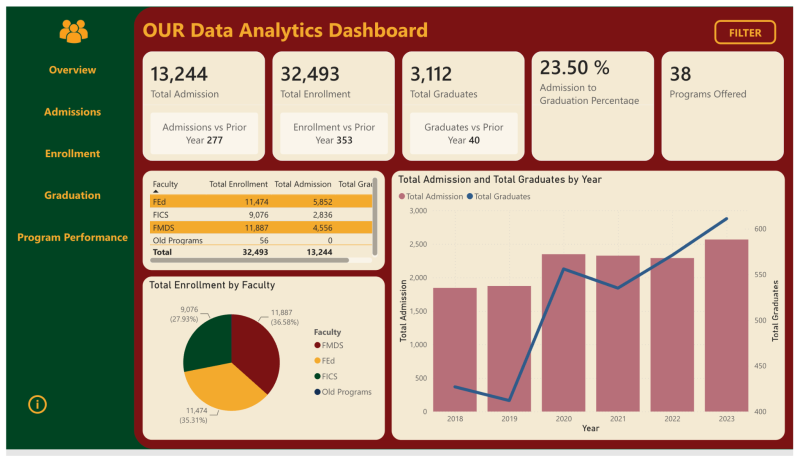
UPOU OUR Interactive Data Analytics Dashboard
Developed using Microsoft Excel and Power BI, the dashboard incorporates trend analysis to present institutional data in an accessible, interactive, and user-friendly format. Users can explore historical trends across academic years, programs, and faculties through dynamic visualizations.
The dashboard was developed by Bachelor of Science in Statistics interns from the University of the Philippines Los Baños (UPLB), Mr. Alfonso Gabriel Andrei A. Jandayan and Ms. Mikyla Rein P. Derequito, during their internship at the OUR from 9 June to 8 July 2026.
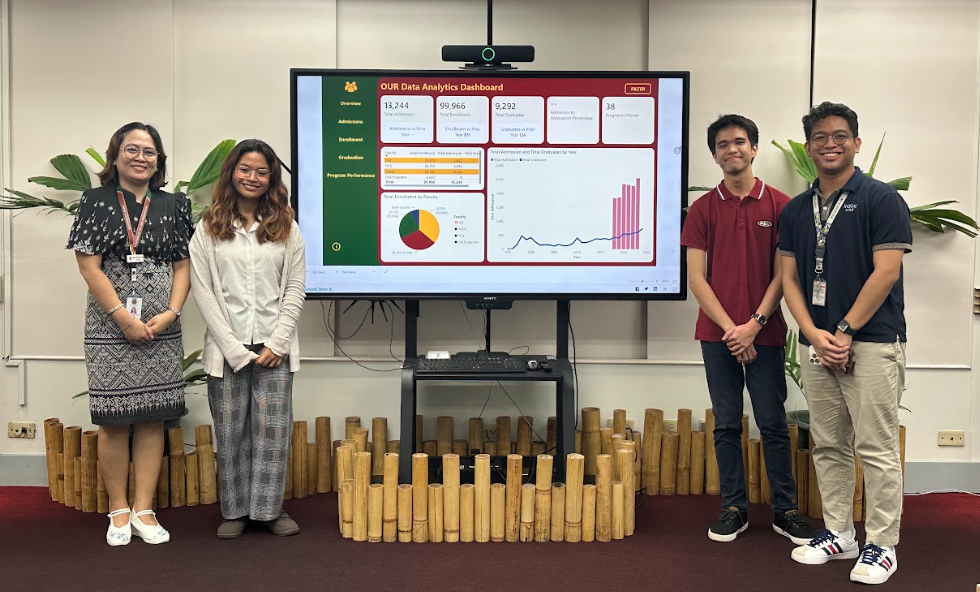
In photo from left to right- Asst. Prof. Blancaflor P. Arada, Ms. Mikyla Rein P. Derequito, Mr. Alfonso Gabriel Andrei A. Jandayan, and Mr. Ian Carlo Naguit, Faculty-in-Charge
The internship project also produced a General Weighted Average (GWA) Calculator developed using Microsoft Excel. The tool automatically converts letter grades and grades from other grading systems into their UP equivalents, simplifying GWA computation and improving the efficiency and accuracy of application processing.
The launch of the Interactive Data Analytics Dashboard reflects the OUR’s continuing commitment to digital transformation, evidence-based decision-making, and service excellence. By making institutional data more accessible and actionable, the dashboard supports data-informed planning, policy development, and operational monitoring within the University.
Written by Percia V. Secreto | Edited by Joanna Viñas , Blancaflor Arada, Anna Cañas-Llamas and Primo Garcia